

Virginia Beach Flood Model Visualization and Exposure Tool Instructions
Flood Model Results Step-by-Step Scenario Selection
Note: The available scenario selections for steps 2 thru 4 will depend on the preceding step selection. Changing a selection in steps 1 thru 3 will clear the selections in the following steps.
-
Select the type of flood/extreme event.
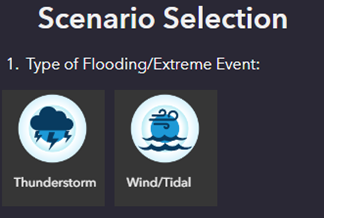
Type of Flooding/Extreme Event
Thunderstorms are rainfall driven flooding events where the user can select the amount of rainfall and sea level rise condition. Wind/Tidal events are wind driven flooding events and Sunny Day/No Rainfall is the only available rainfall selection.
-
Select the amount of rainfall/storm surge.
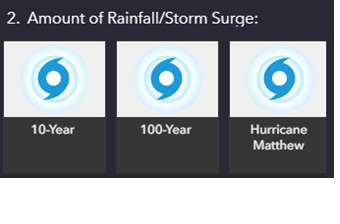
Amount of Rainfall/Storm Surge
The rainfall amounts are provided as hypothetical storm events of a given frequency interval and duration. A 10-year storm event has a 10% chance of occurring in a calendar year. A 100-year storm event has a 1% chance of occurring in a calendar year. It is possible for multiple, larger storm events to occur in a single calendar year. For example, in 2016 in Virginia Beach, three significant rainfall events, including Hurricane Matthew, occurred during a six week period. They consisted of a 100-year (1% chance of occurrence, a 250-year (0.4% chance of occurrence), and a 1000-year event (0.1% chance of occurrence).
-
Select the sea level rise (SLR) condition.
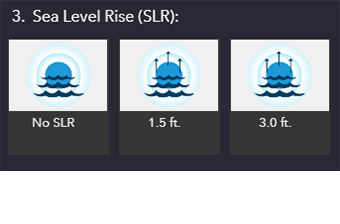
Sea Level Rise Condition
No sea level rise represents today’s conditions, 1.5-feet sea level rise represents possible conditions between the years 2045-2065 and 3-feet sea level rise represents possible conditions between the years 2065-2085. These SLR conditions were developed based on historical analysis and modeling and are described in more detail in the City’sSea Level Wise Adaptation Strategy Report.
-
Select the “Citywide - No Project” or Flood Protection Program (FPP) project model results. FPP project model results are only available for the design condition scenarios. More FPP projects will be added to the tool as final design model results become available.
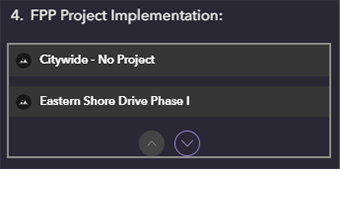
FPP Project Implementation
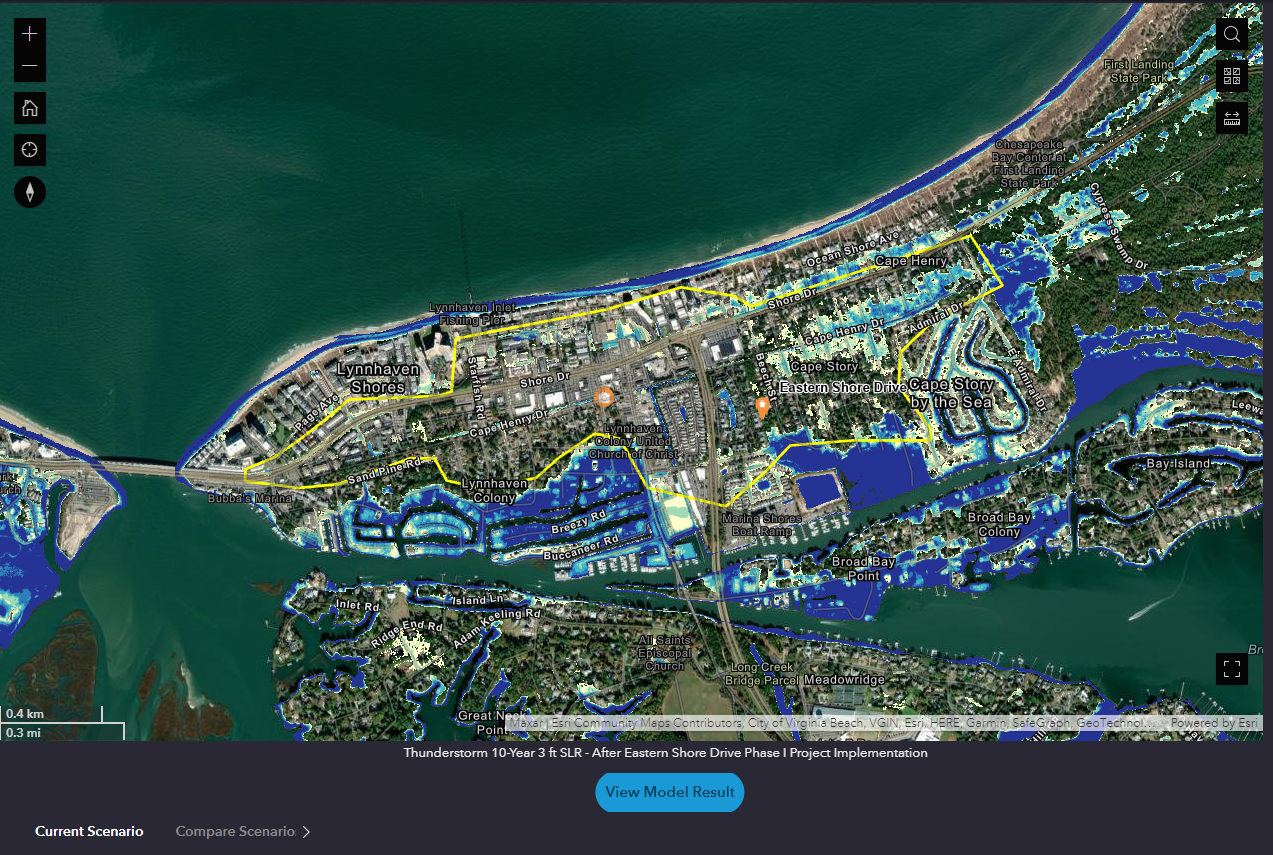
The model results for the selected implemented project are displayed within the yellow project boundary. Model results displayed outside the project boundary are the citywide no project model results for the selected scenario.
-
After a scenario is selected, click on “View Model Result” below the map to display the model results for the current selected scenario. Click on "Remove Model Result" to clear the map display before selecting a new scenario. The name of the scenario is provided below the map. Note: Clear the map display and select "View Model Result" whenever the scenario selection changes to display the newly selected model results on the map.
-
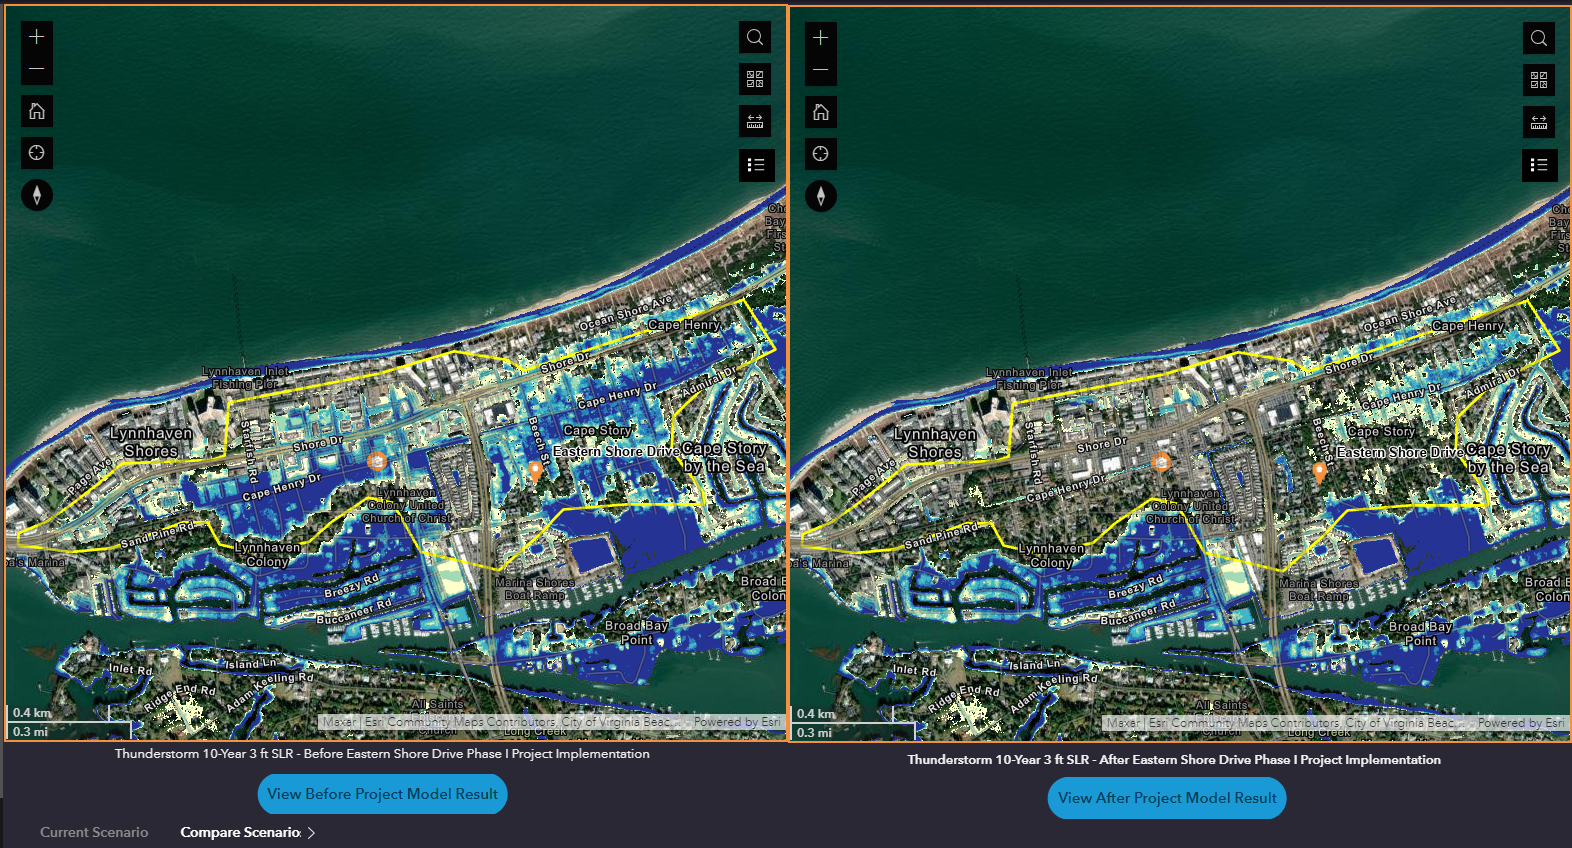
For scenarios where a project is selected, click on “Compare Scenarios” below the map to view before project implementation and after project implementation model results in side-by-side maps. Click on “View Before Project Model Result” and “View After Project Model Result” below the maps to display the model results. Click on "Remove Before Project Model Result" and "Remove After Project Model Result" to clear the map displays before selecting a new scenario. Scrolling on the left map will cause mirrored scrolling of the right map. Note: Clear the map displays and click on "View Before Project Model Result" and "View After Project Model Result" whenever the scenario selection changes.
Flood Depths
The legend shows the colors representing the model flood depths. The legend is shown at the bottom right of the screen on the Current Scenario view.
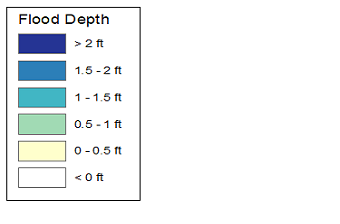
For the Compare Scenarios view, click the icon to display the legend.
Project Information
Click the icon to display project information including the link to the Ripple Effect project webpage.
Before/After Project Implementation 360⁰ Images
Selected project locations display the model results superimposed on 360⁰ photographic images. Click the icon to display the before project implementation 360⁰ image and the after project implementation 360⁰ image.
Flood Exposure Information
Information about flood exposure is provided to the right of the map.
Measure Tool
Click the icon to open the measure tool and measure the distance between two or more points. Start to measure by clicking on the map, click to add more points, and double-click to finish.
Click the icon to open the area measure tool and measure the area and perimeter between three or more points. Start to measure by clicking on the map, click to add more points, and double-click to finish.
The measurements are displayed in the dialog box. Choose the desired unit of measure. Select "New measurement" to clear the points and start a new measurement.
Address Search
Click the icon to open the search bar and find an address.
